
Let Us Get Started... |
Have you ever wondered how online networks actually work? Well now is your chance to find out! Here we explain all about the Mathematics behind such networks, from the terminology used, all the way to analyzing data in order to optimize online impact of a business.
|
What Are Networks?
Graph theory is an essential factor in the understanding of online social networks. For this reason, we shall begin by looking at graph theory, and specifically, networks.
In terms of social systems, a network is a connection between actors (people, online profiles etc.), where relationships exist between certain actors, and not between others. Such actors, or 'nodes', have characteristics. Characteristics include things like being male or female, being a certain age, living in a certain place. There can be relationships between nodes, which we call links. For example, if we have two nodes, one representing person A and the other, person B, then there may be a relationship between A and B, such as working together, living together, or doing a sport together. In terms of networks on social media, there would be a relationship between A and B if they were friends on Facebook, or connected on LinkedIn (or were connected on any other social medium).
Links can interlink through common nodes. For instance, if A and B are connected, and B and C are connected, then it follows that A is connected to C, through B.
One way of representing mathematical networks is through the use of graphs. A graph, G, consists of sets of nodes (or here, online profiles), and a set of edges or relationships (here, connections on online social media). The edges connect pairs of nodes, or, in other words, profiles are connected by online connections.
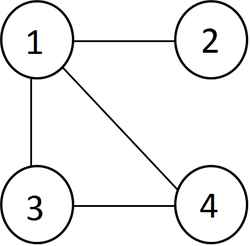
The diagram shows a 'Facebook friends' graph that represents the online relationship
between Person 1, Person 2, Person 3 and person 4:
In the diagram, Person 1 and Person 2 are friends on Facebook. As well as this, Person 1 and Person 3 are Facebook friends, Person 1 and Person 4 are Facebook friends, and Person 3 and Person 4 are Facebook friends.
In this graph, such as in all other graphs SocialMediaNow! uses when analyzing social media networks, every edge means the same thing. Here, each edge represents a connection on Facebook. In another graph, all edges might represent a connection on Twitter, or LinkedIn etc.
What is Social Network Analysis, and Why is it Useful?
Social network analysis is the use of network theory to analyse online social relationships. This is where we come in. Our job is to look at online networks, finding nodes (in this case, online profiles) which are connected to many other nodes. Nodes with a large degree (a large number of relationships with other nodes) have an increased ability to impact others and spread information. Because of this, we use these highly-connected nodes, or 'egos', to increase the online reach of your business. By engaging with influential members of online communities, it is possible to increase your business standing. These influential members also have knowledge on how to gain a vast number of online connections, as they have experience in doing so. Therefore, by observing such influential members, it is also possible to better understand how to relate to consumers.
To make it easier to spot the influential members of online social media, we can establish the 'degree' of each member or node (how many connections each member has), and list nodes and their degrees as below:
To make it easier to spot the influential members of online social media, we can establish the 'degree' of each member or node (how many connections each member has), and list nodes and their degrees as below:
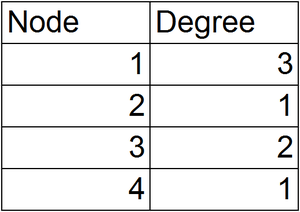
The table above represents data from the initial diagram (also above), and shows that Person 1 has three connections, Person 2 has one connection, and so on. It is clear to see that, when listed in this format, the nodes (members) with
the highest degree, and therefore the largest number of connections, and so the greatest online influence, can
be easily picked out from the data.
Finding the degree of each member of an online social medium, and then comparing degrees of all members can be a long and daunting task when manually undertaken. Luckily for us, we have been able to design our very own piece of software that does this for us! (See later section entitled 'Types of Software we Use to Analyse Online Networks' for more information on this).
This software gives us a list of influential members, or a list of trending words/phrases/hash-tags, depending on what we input. With this information, it is then very easy to establish which members of the online community our clients should target, and what topics to post about on social media to seem more relate-able to their customers . Our clients may wish to sponsor such influential members to advertise their companies, or simply approach such influential members about re-posting information about their business on social media.
Where Do We Get Our Data? (Sources of Network Data)
The simplest way of collecting data is through the use of surveys and questionnaires. Using this method, the ties (or connections) among all pairs of nodes (or members) are collected by asking members who they are connected to on social media. If we are only including non-private social media profiles in our network, then this data can easily be collected by looking on each individual profile to see how many connections have been made. However, this would take a vast amount of time when taking into consideration the whole of one social medium.
But this is not a problem! Many online social media sites contain information about connections between members. A large amount of data can be gathered from social media such as Facebook, Twitter, Linkedin etc., much of which is already in the desired format. However, some of the information on these sites may require software in order to be collected, put into easily-analysed formats, and then analysed . (see later section 'Types of Software we Use to Analyse Online Networks').
Social media that SocialMediaNow! analyzes for our clients includes Facebook, Twitter, LinkedIn and YouTube. However, if there is a social media that we do not currently offer services for, and you would like us to analyse for your business, simply send us an email letting us know and we will alter our software accordingly.
Centrality - What Is It and How Do We Measure It?
It is of vast importance to know who is central in a network if you want to spread a piece of information as far as possible. This can be seen in the example of a unionization drive that David Krackhardt used in 1992. Krackhardt set the scene as follows:
A union made a man named Hal their main man during a unionization drive. Hal was very enthusiastic, but interestingly not central in the friendship network. The union lost by a vast amount when there was a vote.
However, there was another member of the union named Chris who was highly central in the friendship network. Chris was not made the main man during the unionization, as he was very friendly with the owner, and did not want the union to harm profits. If the rest of the union had approached Chris with the argument that they would not harm profits, but would simply like some of the profits to be shared among workers, Chris may have become the main man, and the union would have been much more likely to have won the vote.
This example can be used to illustrate the power that centrality can have when getting ideas and opinions across to groups of people. For this reason, it is essential to obtain information on highly central, and therefore highly influential, members of online social media so that this can be used in increasing the online spread of a business.
But this leaves one very important question - how do we figure out who is most central in a network? The answer to this is simple! We earlier discussed degrees of nodes, meaning the number of connections each member of an online social medium has. The centrality of a node in a network is related to the contribution the node makes to the structure of the network. Therefore, the higher the degree of a node, the more central it is in the network - easy!
Example of Network Data Analysis - Use of Software
There are many types of software that can be used to analyse online networks. At SocialMediaNow!, we have designed our own software to ensure we provide the best possible outcome for our clients.
Dr. Jagpreet Dhaliwal and Dr. Jordan Hunt, our two software experts here at SocialMediaNow! have written us a quick report of how the software actually works, and what information we can find out using it:
''Would you like to increase your firm’s online impact? Here at SocialMediaNow! we have the perfect solution to help you achieve this. We have made the visual analysis of emerging trends on Twitter possible through software called Python. With this, you will be able to see what the most popular trending tweets are in any specified area in the world at any time. However, it does not stop there. We have also made it possible for you to know the frequency of the influential members of the Twitter community speaking about these trends and who these influential members are! Your firm will be able to increase your standing by engaging with these influential members of Twitter with our help.
By inputting 'trends(WOEID)' in to the software (where WOEID is the code for the location you want to find the most popular trends for), a pie chart will be produced. The pie chart below shows the most popular tweets in the world on 11/03/15 at 15:30. The numbers in the legend represents the frequencies of influential members who have made tweets about these trends.
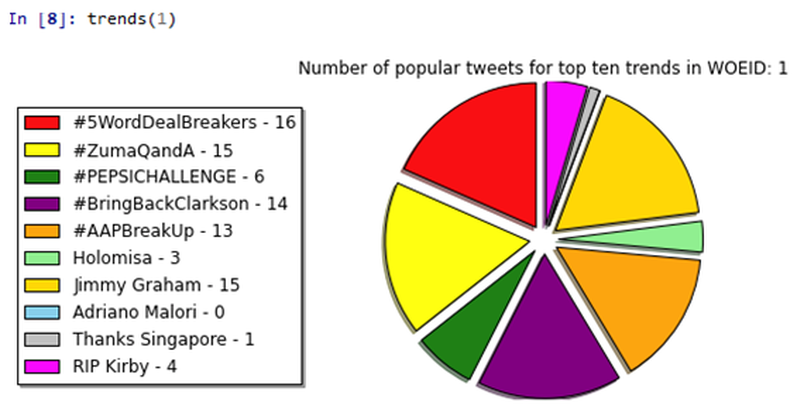
From this pie chart we can clearly see that the most popular trend in the world in regards to influential Twitter members is ‘#5WordDealBreakers’ and the least popular being ‘Adriano Malori’ with sixteen influential members tweeting about ‘#5WordDealBreakers’ and no influential members tweeting about ‘Adriano Malori’.
It is also possible to find out who these influential members are. By choosing a user ID from the list that appears under the pie chart, we can now input this ID back into the software to find the user who the ID belongs to.
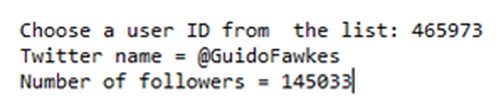
If we do this for Twitter ID 465973, the above output appears. This shows us that one of the influential members tweeting about one of the top ten trends was Guido Fawkes.''
